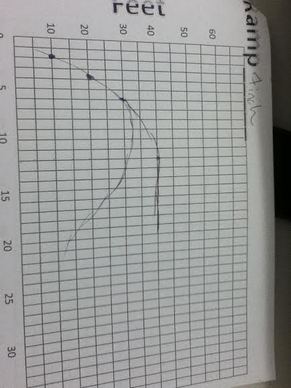
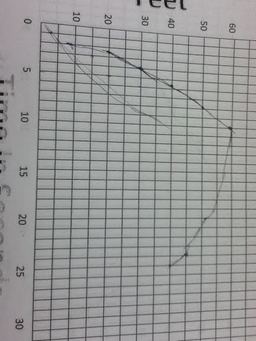
My prediction to the actual graph was not that far off, some of my points did go through the actual graph. The graphs were different because I was plotting a graph of how I was seeing it and how I thought it would go rather than what was actually happening. The zeros of my graph represent where certain points of the graph were. The three graphs are similar because the skateboard traveled in a similar pattern each time. The maximums and minimums are a little bit different because of the height that the board was released each time, that is also what made the graphs different. the graph is rising the fasted right when it leaves the ramp and it falls the fastest when it first starts to travel back down the driveway. This means that it is using momentum to approach the maximum and minimum points of the graph. | 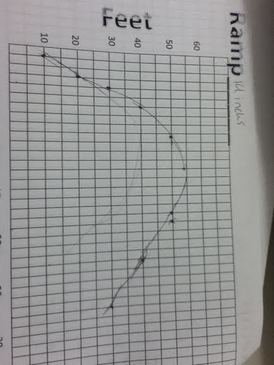 |