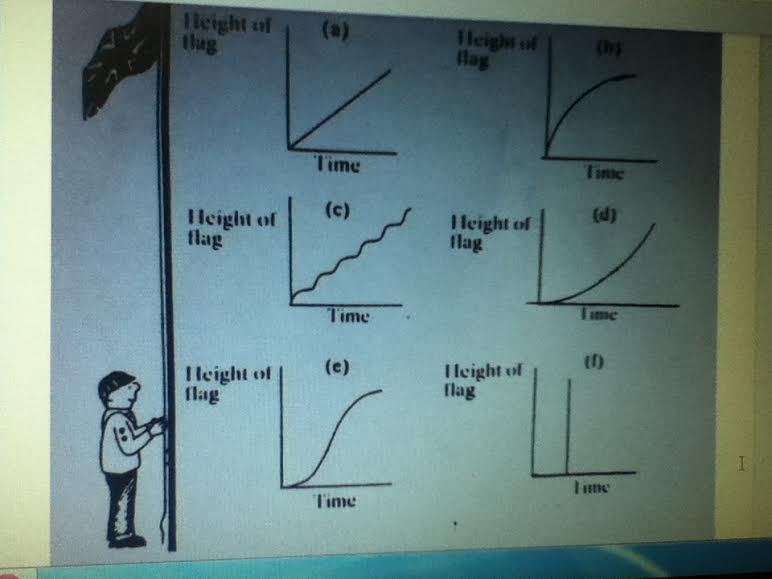
 | The A graph represents a linear function, the B graph represents a square root function,the D graph represents an exponential growth function,the F graph represents a vertical line graph, I really don’t know how to explain the C or E graphs.. The F graph is the most realistic because the flag would be traveling straight up. The graph C is the least realistic because the flag would be traveling in a very random pattern. |
|
0 Comments
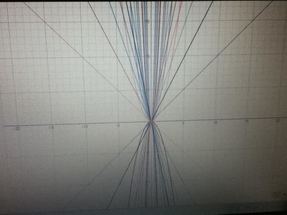 I made this interesting image by using different equations. I used many linear and quadratic equations. I also used many colors to create contrast between the different types of equations.
|
